
How Utah has changed this decade


Ten booming years in Utah has resulted in … more.
There are more people and that means houses cost more. The state’s biggest tourist sites are more crowded than ever. More teens are puffing on a vape pen, though was vaping even a thing 10 years ago?
Salt Lake Tribune reporters are telling the story of the 2010s through numbers that show big changes in our state. There’s far too much that happens in 10 years to cover it all, so we’re focusing on these areas — people, the economy, health and the environment.
PEOPLE
Utah families are having fewer babies
One of the biggest changes is that Utah’s fertility rate dropped below replacement level — and essentially fell off a cliff in the past decade.
“They said it would never happen here,” said Pam Perlich, senior demographer at the University of Utah’s Kem C. Gardner Policy Institute. “No one who knew the old Utah ever expected this to happen — or so quickly.”
The 2018 total fertility rate for Utah — the number of children each woman here would expect to have in her lifetime — has now dropped to 2.03, according to the National Center for Health Statistics. The rate to exactly replace the population over time is 2.1
The new rate is less than half of Utah’s fertility rate of 4.3 back in 1960. It also comes after 11 straight years of decreases since the rate was 2.68 in 2007.
Utah’s declining fertility rate
For the first time, Utah families are not having enough babies to replace the population. That mirrors national trends.
Source: National Center for Health Statistics
Graphic by Christopher Cherrington | The Salt Lake Tribune
Utah had the highest fertility rate in the nation for decades, but the state has dropped to No. 4 — behind South Dakota, North Dakota and Nebraska.
Perlich notes that in the past it was not unusual to see Utah parents with six or more children. But she says a Latter-day Saint family is now much more likely to have four, three or even two kids.
Another change is that Utahns are waiting longer to get married -- if they marry at all.
The median age for Utah men at their first marriage increased from 29.6 to 31 in the decade, according to Census Bureau estimates. The age for women at their first marriage rose from 26.7 to 28.3.
Utah sees a big rise in gay marriages
At the beginning of the decade, gay marriage was illegal in Utah. That changed with a Dec. 20, 2013, federal court ruling here — which led to a quick flurry of marriages. They were soon halted amid legal appeals but allowed again in October 2014 after the U.S. Supreme Court refused to hear the case.
Now, about 4,182 gay couples are married here, according to Census Bureau estimates.
The census reports Utah had 6,017 gay couples living together in 2018 in Utah, and that 69.5% of them were married.
Same-sex couples in Utah
This graph shows the number of same-sex couples in Utah, 2010-2018.
Source: U.S. Census Bureau
Graphic by Christopher Cherrington | The Salt Lake Tribune
As a sign of how times have changed, Perlich said that if same-sex couples reported they were married in the 2000 Census — which was possible if they wed outside the country — the Census Bureau would arbitrarily assign one partner a different sex in the data.
It estimated that the number of gay couples living together here in 2010 was 3,937 — meaning their number has jumped about 52% in the decade as social acceptance grew.
The state's population flies past the 3 million mark
Utah’s population boomed during the decade from just under 2.8 million people to 3.2 million — up by nearly 450,000. That 16.2% growth is like adding the combined population of Utah’s three largest cities — Salt Lake City, West Valley City and Provo — to the state this decade.
With that, Utah passed the 3 million mark in late 2015.
Utah's population growth
This graph shows Utah's total population, 2010-2019.
Source: Gardner Policy Institute, The University of Utah
Graphic by Christopher Cherrington | The Salt Lake Tribune
It took 119 years for Utah to reach its first 1 million residents, from when the Mormon pioneers arrived until 1966. It then took 29 years to hit 2 million in 1995. It took another 20 years to achieve 3 million. And state officials have projected hitting 4 million in just 16 years, or 2031.
A bigger percentage of that growth is coming recently from people moving to the state than from births as Utah’s recently hot economy and jobs act as a magnet.
“Utah has become more and more interconnected with the global economy,” Perlich said, especially its high-tech industries that draw workers from around the world.
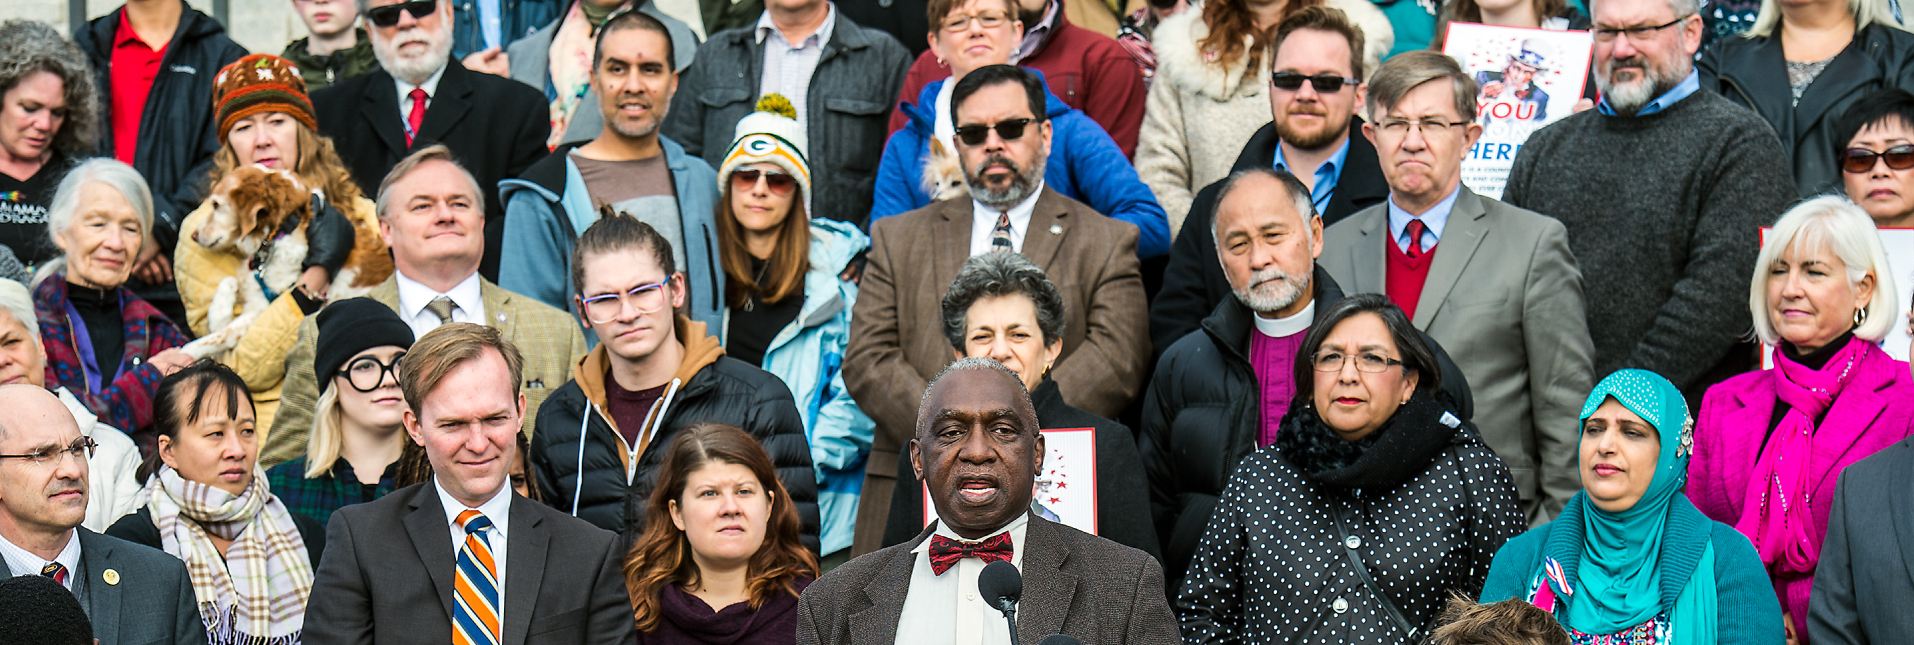
State diversifies, West Valley City became minority majority
Utah’s minority population grew by 160,000 during the decade. More than one of every five Utahns is now a minority, 22.2%. But among children under 18, that number is 26.5% — making the state’s schools more diverse than the overall population.
Utah’s minority population has now climbed to 701,214 people.
Utah’s Hispanic population grew by 25.6% between 2010 and 2018. That’s more than twice as fast as the 10.8% growth in Utah’s non-Hispanic white population.
But other minorities expanded even faster.
Utah's minority numbers
This graph shows Utah's total number of minorities, 2010-2018.
Source: U.S. census
Graphic by Christopher Cherrington | The Salt Lake Tribune
The Asian population grew by 48.5%; the number of people who are “two or more races” grew 42.5%; blacks by 37.9%; and Pacific Islanders grew by 27.5%. American Indians had a slower 9.9% increase.
Utah’s second-largest city, West Valley City, even became “minority majority” last year, and is now 54.7% minority. At the beginning of the decade, 46.3% of its residents were minorities.
While Latinos formed the biggest group of immigrants early in the decade, Asians now do — attracted by tech jobs and universities, Perlich said.
As a sign of how diverse the people who come to Utah are, Perlich notes that the Utah State School Board reports that 143 languages besides English are spoken by students at home in the state. That is up from 129 languages five years ago.
Salt Lake County is now minority Latter-day Saint
Utah’s biggest county and one of its most diverse hit a milestone that has been decades in the making — fewer than half of Salt Lake County’s residents are on the membership rolls of The Church of Jesus Christ of Latter-day Saints.
This shift, which happened in 2017 and has accelerated since then, has huge implications for the county’s politics, schools and culture.
As of September 2019, the county’s population is 47.87% percent Latter-day Saint, according to numbers the church provides the state government for demographic purposes. That’s down from 51.44% in 2010.
Salt Lake County's declining Latter-day Saint population
This decade, Salt Lake County became minority-Latter-day Saint, a huge shift as the state's population continues to diversify.
Source: The Church of Jesus Christ of Latter-day Saints
Graphic by Christopher Cherrington | The Salt Lake Tribune
This decline has been driven by people moving to Utah, who are less likely to be members than those who are born here, and by the slowing fertility rate. But also, it has been impacted by disaffected Latter-day Saints who have resigned their memberships.
The county saw an actual numerical decline in Latter-day Saints in 2018 and 2019, which is unusual.
Salt Lake County is one of five minority-Latter-day Saint counties in Utah. The others are Carbon (46.85%), San Juan (35.91%), Summit (28.54%) and Grand (25.12%). Overall, Utah is 60.68% Latter-day Saint.
Utah County becomes a powerhouse
While Salt Lake County had been the epicenter of Utah growth since it was settled by pioneers, that shifted this decade to Utah County. Growth has boomed as people move there for more affordable housing and for jobs sprouting in its Silicon Slopes.
From 2010 to 2019, Utah County’s population ballooned by 26.1% — adding 134,845 people, equivalent to the population of West Valley City.
Meanwhile, Salt Lake County added 123,305 people in the decade — 11,540 fewer than its neighbor to the south — up by 12%.
Utah county's population growth
This graph shows Utah county's total population, 2010-2019.
Source: Gardner Policy Institute, The University of Utah
Graphic by Christopher Cherrington | The Salt Lake Tribune
While Utah County has been known for its high fertility rates and many babies, for the first time last year more of its growth came from immigration than births, 50.1% to 49.9%.
Perlich said few people would have predicted such change 20 years ago, or even 10. “It was a lot of open spaces and a lot of beautiful agricultural land,” she said. It is on its way to total development as part of the overall urban area.
HEALTH
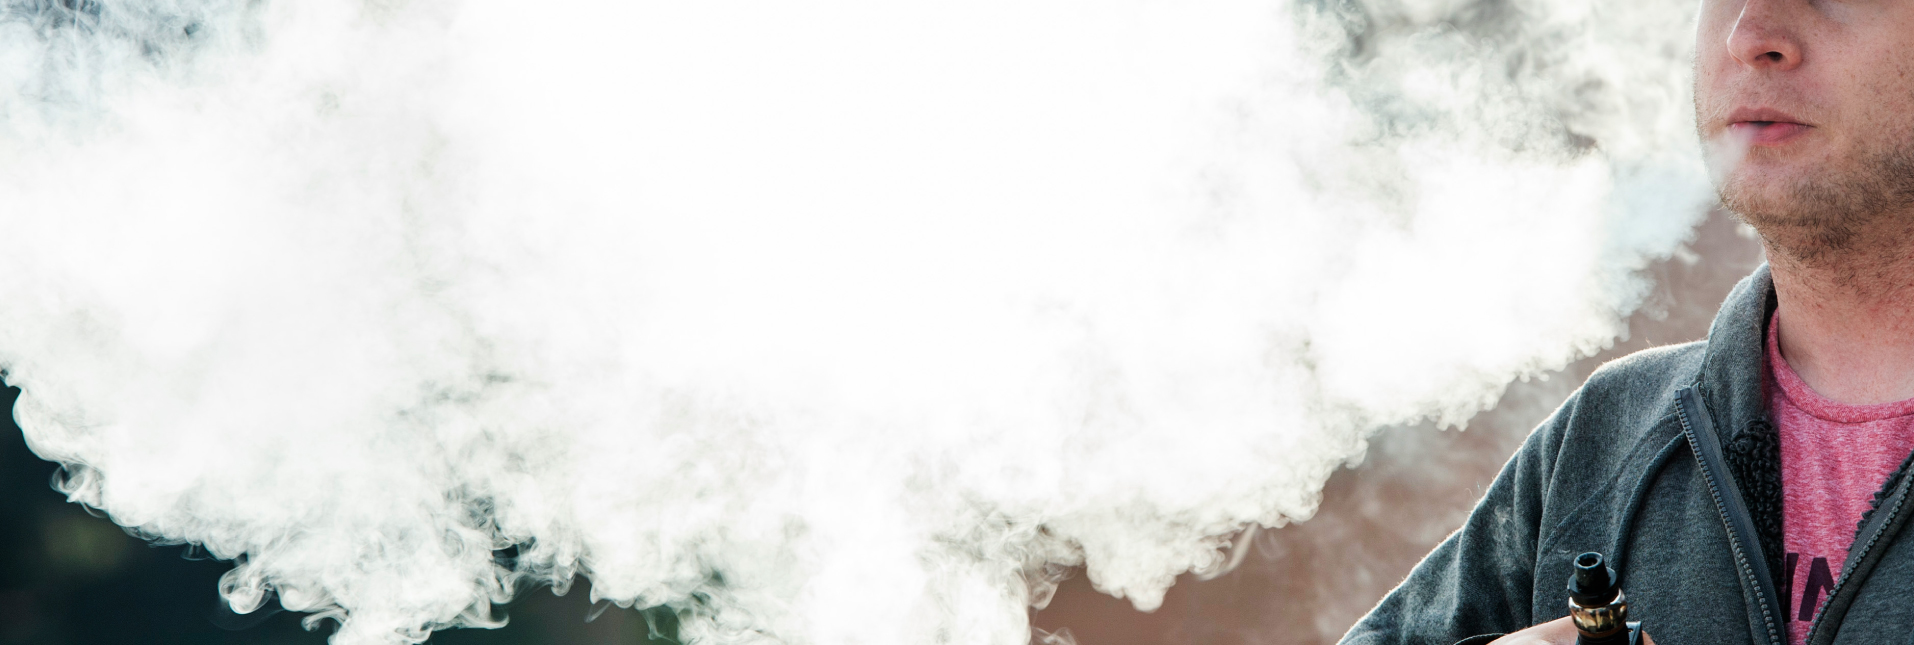
Vape smoke surrounds Utah high school students
Sarcastic high schoolers often call school restrooms “vape rooms," and they hung out there more and more so as the decade went on.
Back in 2011, when Utah officials began asking teens about vaping, only 1.9% self-reported they used e-cigarettes. By 2019, that number had jumped to 12.4%.
The same teens were asked about alcohol and tobacco use in the state’s Student Health and Risk Prevention survey, which is conducted in Utah public schools in the spring of odd-numbered years. The survey also asks questions about students’ mental and physical health, substance abuse and anti-social behaviors.
Teen vaping
More Utah teens than ever report using vaping products in a state survey. This graph shows the percentage of teens who vape.
Source: The Utah Department of Health
Graphic by Christopher Cherrington | The Salt Lake Tribune
In the latest survey, Utah students were significantly more likely to report trying alcohol and e-cigarettes than conventional cigarettes. Teen use of cigarettes was highest in Uintah, Duchesne and Daggett counties, while e-cigarette use was highest in Weber and Morgan counties.
The Utah Department of Health has urged people to stop vaping THC — which is the psychoactive substance in marijuana — amid a recent outbreak of vaping-related lung injuries.
As of Dec. 9, there were 115 lung injury reports connected to vaping in Utah. There’s been one death. Most of those who became ill are in their 20s and 30s, with just over 15% of cases involving teens age 19 and younger.
Nationwide, the Centers for Disease Control and Prevention reported 2,409 cases of vaping-related lung injury and 52 deaths.
The number of Utahns who have died by suicide has steadily increased over the past decade.
There were 466 Utahns aged 10 or older who died in 2010 — a rate of 20.6 deaths per 100,000 people. That number increased year by year, and in 2018, there were 666 suicide deaths, a rate of 25.14.
That means Utah has the sixth highest suicide rate in the nation, according to the most recent data (2017) from the CDC.
Utah suicide rates
The number of Utahns who died by suicide has increased every year through the last decade. This graph shows suicide deaths per 100,000 population, 2010-2018.
Source: The Utah Department of Health
Graphic by Christopher Cherrington | The Salt Lake Tribune
But could this trend reverse in the next decade? State officials said in November that the year-to-year rate of suicide in Utah decreased this year — the first time in more than a decade. But they warned that the reduction isn’t statistically significant, and public health experts typically look for consistent reductions over three years before confirming a trend.
Kimberly Myers, the state’s suicide prevention and crisis services administrator, said the recent decrease is in line with statewide changes that began around 2013 to improve coordination among health care workers, schools and state agencies on mental health interventions. The Legislature provided funding for officials to develop this unified strategy.
“We, for the first time in many, many, many years, pulled together a group of stakeholders and wrote a state suicide prevention plan,” Myers said. “If you look at the science of prevention, it suggests once you start reducing risk factors, having a strategic plan and implementing it ... it’s usually about a three- to five-year process to when you start seeing reductions.”
Meth makes a deadly comeback as opioids remain a persistent killer
Prescription opioids hit Utah, and much of the nation, hard this decade but pill-related deaths have been declining in recent years. Heroin deaths are down too, according to Meghan Balough, a state epidemiologist.
There has, however, been a huge spike in meth-related overdose deaths, more than doubling in the past five years. Drug overdose deaths involving meth rose from a low of 31 in 2010 to 217 in 2018, according to records from the Utah Department of Health.
In fact, meth-related deaths surpassed street heroin death for the first time last year. In many overdose deaths, multiple drugs are involved.
Meth overdose deaths in Utah
Overdose deaths involving methamphetamine have risen precipitously in recent years. This graph shows the crude rate of accidental and undetermined deaths in Utah involving methamphetamine per 100,000 population, 2010-2018.
Source: The Utah Department of Health
Graphic by Christopher Cherrington | The Salt Lake Tribune
Brian Redd, the chief of the State Bureau of Investigation, said market factors could explain meth’s rapid rise. It’s about a tenth of the cost now that it was in the early 2000s, according to Redd — a pound costing between $1,000 to $1,500, with a single hit going for about $20.
In some cases, meth dealers are making their way into markets where opioid use is declining, Redd said. In others, it’s replacing costlier drugs like cocaine, which is now 10 times as expensive as meth.
Meth use has been rising nationwide, but especially in the West, according to federal health data. Utah had the ninth-highest rate of deaths involving psychostimulants with the potential for abuse — chiefly meth, but that also includes ecstasy and some drugs for attention deficit disorder.
Sexually transmitted diseases became far more common
The state has seen a spike in sexually transmitted diseases, particularly chlamydia and gonorrhea, according to the state Health Department.
The rate for chlamydia infections was 240 cases per 100,000 people in 2010. The rate rose to 333 by 2018. Gonorrhea was less prevalent, but the rates for that STD skyrocketed — an 834.7% increase — from 2010 to 2018, rising from 11.2 cases per 100,000 people to 91.6 cases.
Chlamydia and gonorrhea are two of the more than 70 diseases that doctors, clinics and other providers are required to report to public health officials.
Chlamydia rates
The sexually transmitted infection chlamydia has become the top reported disease in Utah in recent years. This graph shows chlamydia cases per 100,000 population, 2010-2018.
Source: The Utah Department of Health
Graphic by Christopher Cherrington | The Salt Lake Tribune
The Utah Department of Health said the increase in chlamydia rates could be attributed to increasingly sensitive diagnostic testing, efforts to boost reporting by providers and labs and improved information systems for reporting.
But the rise in gonorrhea and chlamydia cases in recent years — especially among teenagers — is alarming to Salt Lake County Health Department Director Gary Edwards. In August, he released a statement that said Utah’s approach to STD education isn’t working.
“Teens need accurate, realistic and comprehensive STD education,” he said, “whether that’s at home, at school, at church or in another venue appropriate for the discussion.”
More Utahns have at least some type of health insurance
In the past decade, few issues were as politicized as health insurance. First, the Affordable Care Act required people to buy insurance or face a fine and offered hefty subsidies for those who had a hard time affording private coverage and did not qualify for government programs like Medicaid.
That led to a decline in the number of Utahns who went without insurance, but Utah didn’t immediately expand Medicaid as the law pushed by former President Barack Obama allowed. Instead the issue became entangled in lengthy and arduous legislative debates, killed by conservatives who despised the new health care law and warned that Medicaid expansion could eventually bankrupt the government. Ultimately, voters approved a ballot measure to fully expand Medicaid — a move that was estimated to allow coverage for an additional 150,000 Utahns.
But lawmakers repealed and replaced the voter-backed law with one that allowed more modest expansion of Medicaid, enough to cover an estimated 90,000 more residents. Subsequently, the federal government rejected Utah’s requested waiver for the new partial program, but after some wrangling, signed off on a full Medicaid expansion with some work requirements. That starts Jan. 1.
Utahns without health insurance
A Census Bureau survey shows a decline in the number of Utahns who don't have health insurance. This graph shows the crude percentage of persons in Utah with no health insurance coverage, 2010-2017.
Source: The Utah Department of Health
Graphic by Christopher Cherrington | The Salt Lake Tribune
All of this fighting over insurance and how much it costs took place while more people signed up. The number of Utahns without health insurance shrunk over the past decade, according to the U.S. Census Bureau.
The Census’ American Community Survey found that 8.7% of Utahns reported that they did not have health insurance in 2017, the latest available data.
That was down significantly from 2010, when 15.5% of survey respondents in the Beehive State said they didn’t have coverage.
With full Medicaid expansion, the uninsured rate is expected to dip even further.
ECONOMY
Utah’s economy roared, lifting wages too — eventually
The economic downturn from 2007 to 2009 hit Utah hard, but not as hard as it did many other states or the country as a whole. Similarly, the Beehive State rebounded more quickly as remnants of the Great Recession gave way to an economic boom.
In the past decade, key measures such as jobs and the state’s gross domestic product — the total value of all goods and services produced — rose at record rates, repeatedly earning Utah’s economy national kudos. Many local businesses expanded and out-of-state companies discovered our well-educated workforce, lower wages and opportunities for using outdoor recreation as a way to attract talented professionals.
Incomes are up
Utah’s median household income gained significant ground over the decade, as the state’s economy soared. This graph shows the median household income in Utah, 2010-2018.
Source: U.S. Census Bureau
Graphic by Christopher Cherrington | The Salt Lake Tribune
Exports from Utah have grown steadily. With a robust pipeline of new entrepreneurs trained at Utah’s colleges and universities, a nurturing culture for startups has flourished. The state's tech sector, centered on Silicon Slopes, with above-average salaries, has also grown dramatically, and so have the fields of retail trade, and professional, scientific and technical services.
By 2018 — the latest year for which there is hard data — median household incomes in the state had seen a nearly 18% jump from their 2010 levels. And judging from the years since 2016, the future trajectory is upward.
Housing prices went up and up and up
Utah’s relatively rapid recovery from the Great Recession came with at least one downside. Nation-leading levels of economic growth and job creation since 2010, along with the state’s renowned homegrown population increases, created exceptional demand for housing — and pushed home prices skyward.
Costs for new and existing single-family homes grew over the decade at a yearly pace comparable to housing in cities such as San Francisco and San Jose. The median price of a home in Salt Lake County went up 73% in those 10 years, to at least $381,000, leading to similar rises in counties on and off the Wasatch Front.
Incomes grew, but failed to grow that quickly. At the same time, home construction since 2010 has lagged behind Utah’s torrid pace of making new families and households, leading to a gap of tens of thousands of available homes. The result: a housing affordability pinch with wide implications
Housing prices
The median price of a home in Salt Lake County rose 73% over the decade, from $220,000 to $381,000. This graph shows the median price of a home in Utah, 2010-2019.
Source: Salt Lake Board of Realtors
Graphic by Christopher Cherrington | The Salt Lake Tribune
Home sales have slowed. Large numbers of households remain doubled up, with more than one family to a dwelling. Many would-be sellers find they can’t afford to buy a house in their own neighborhood today, much less move up. Homebuyers who can locate a bargain are often forced into longer commutes or other compromises.
Renters, too, are getting squeezed, particularly those at lower incomes and residents in vital blue-collar professions. Monthly rents continue to climb, even as the Wasatch Front sees historic levels of apartment construction. More Utahns are “cost burdened” today, meaning they pay half or more of their income for shelter, often putting them one financial crisis away from homelessness.
Together, these trends have brought new urgency to debates in city halls across Utah, especially over density. Business leaders warn of long-term effects to the state’s economy if the situation continues — and, as building costs continue to rise, it appears it will.
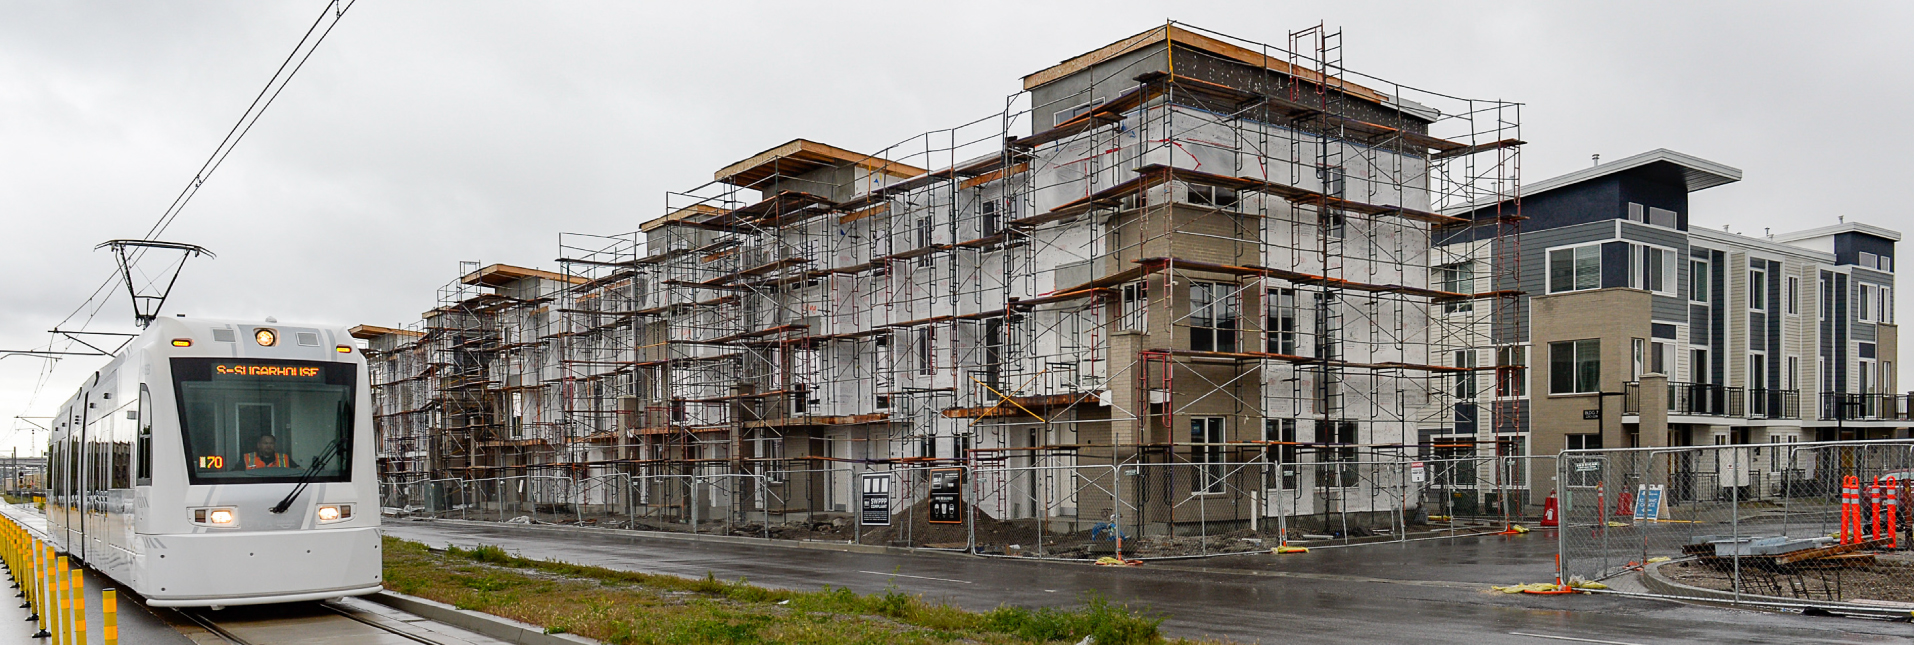
Huge apartment complexes rise throughout the metro area
When it comes to housing in Utah, it was a decade for apartments. Lots of apartments.
The Great Recession shattered old patterns of homeownership in many ways, as new realities of stagnant incomes, student debt and disillusionment over the nation’s foreclosure crisis during the previous decade took hold. Overlaying those trends, supplies of undeveloped land in or near Utah’s population centers are running out, squeezing developers to build denser housing on the plots that are available.
Apartment vs single-family home construction
Apartments, duplexes, town homes and other types of housing made up a larger share of all homes built in Utah in 2019, breaking a trend from previous years.
Source: Ivory-Boyer Construction Database
Graphic by Christopher Cherrington | The Salt Lake Tribune
Cities across the state approved building permits for a total of 44,444 new apartments over the past 10 years, more than double the number built in the decade prior. All but tiny shared of those new units were in larger apartment complexes with five dwellings or above.
Numbers for single-family homes — long the mainstay of housing in Utah — were still far larger, with more than 93,229 approved over the past decade. But where those more traditional homes made up 75% of all dwellings built in Utah in 2000, they account for less than 44% of the total today.
Along the Wasatch Front, new zoning has increasingly steered these residential complexes to locate along new transit lines, changing the look of neighborhoods and business corridors in many cities forever.
The tech sector becomes a powerhouse, attracting jobs and billion-dollar deals
Utah’s technology industry reached a critical mass over the decade, as the sector saw several billion-dollar initial public offerings and acquisitions, the number of tech firms in the state surpassed 6,700, and employment swelled.
Moreover, the notion of Silicon Slopes — the cluster of Utah tech companies centered along Interstate 15 between Salt Lake and Utah counties — went from an emerging ecosystem of companies and startups in 2010 to a well-rounded sector with a worldwide reputation.
Technology sector
The technology industry in Utah reached a critical mass over the decade, as the sector saw several billion-dollar IPOs and acquisitions, the number of tech firms in the state surpassed 6,700 and employment grew dramatically.
Source: University of Utah’s Kem C. Gardner Policy Institute
Graphic by Christopher Cherrington | The Salt Lake Tribune
That progression can be mapped in big deals. Ten years ago, software giant Adobe bought Lehi-based Omniture for $1.8 billion, in what many saw as the start of a new era in tech for Utah. Fast forward to 2018, which saw successful stock offerings by Utah companies Pluralsight and Domo — only to be capped that September by the $8 billion acquisition of customer-survey software firm Qualtrics in Provo by SAP, a German multinational powerhouse in cloud and business services. Those data points alone, several leaders in the industry say, speak to the sector’s global presence.
But the upward cycle of Silicon Slopes can also be measured in the sheer number of jobs it generates. A study issued in 2019 found the sector’s total economic impact in Utah had reached $29.7 billion. One in seven of all jobs in the state are now tied to the sector, accounting for more than 16% of all worker earnings and generating more than $2.5 billion in state and local taxes.
ENVIRONMENT
The air is getting cleaner ... really
The Wasatch Front long has struggled with episodes of poor air quality, driven by fine particulate, or PM2.5, in winter and ground-level ozone in summer. But data compiled by the Utah Division of Air Quality paint a brightening picture over the past decade.
Overall emissions of all pollutants during inversion season declined 30.5% between 2011 and 2019, from 410 tons per winter day to about 285 tons in the Wasatch Front counties. Many of the gains were attributed to reductions in vehicle emissions. PM2.5, much of which is formed in the atmosphere, consists of tiny particles that can penetrate deep into lung tissue and possibly enter the bloodstream, increasing the risk of respiratory illness, cardiovascular disease and decreased brain function.
Wasatch Front emissions
This graph illustrates how wintertime emissions have changed since 2011.
Source: Utah Division of Air Quality
Graphic by Christopher Cherrington | The Salt Lake Tribune
Despite an ever-increasing number of miles driven, vehicle emissions dropped by nearly half, reflecting improvements in automobile engines and the expansion of low-emission, hybrid and electric vehicles.
Accordingly, the number of days the Salt Lake Valley’s air quality breaches the federal threshold for PM2.5 each year is on a downward trend, although the actual number goes up and down year to year in response to weather conditions. Just 2% of last year, or on seven days, did the airshed exceed the 24-hour federal limit of 35 micrograms per cubic liter. A decade earlier it had been, on average, 4% of the time, according to the state division.
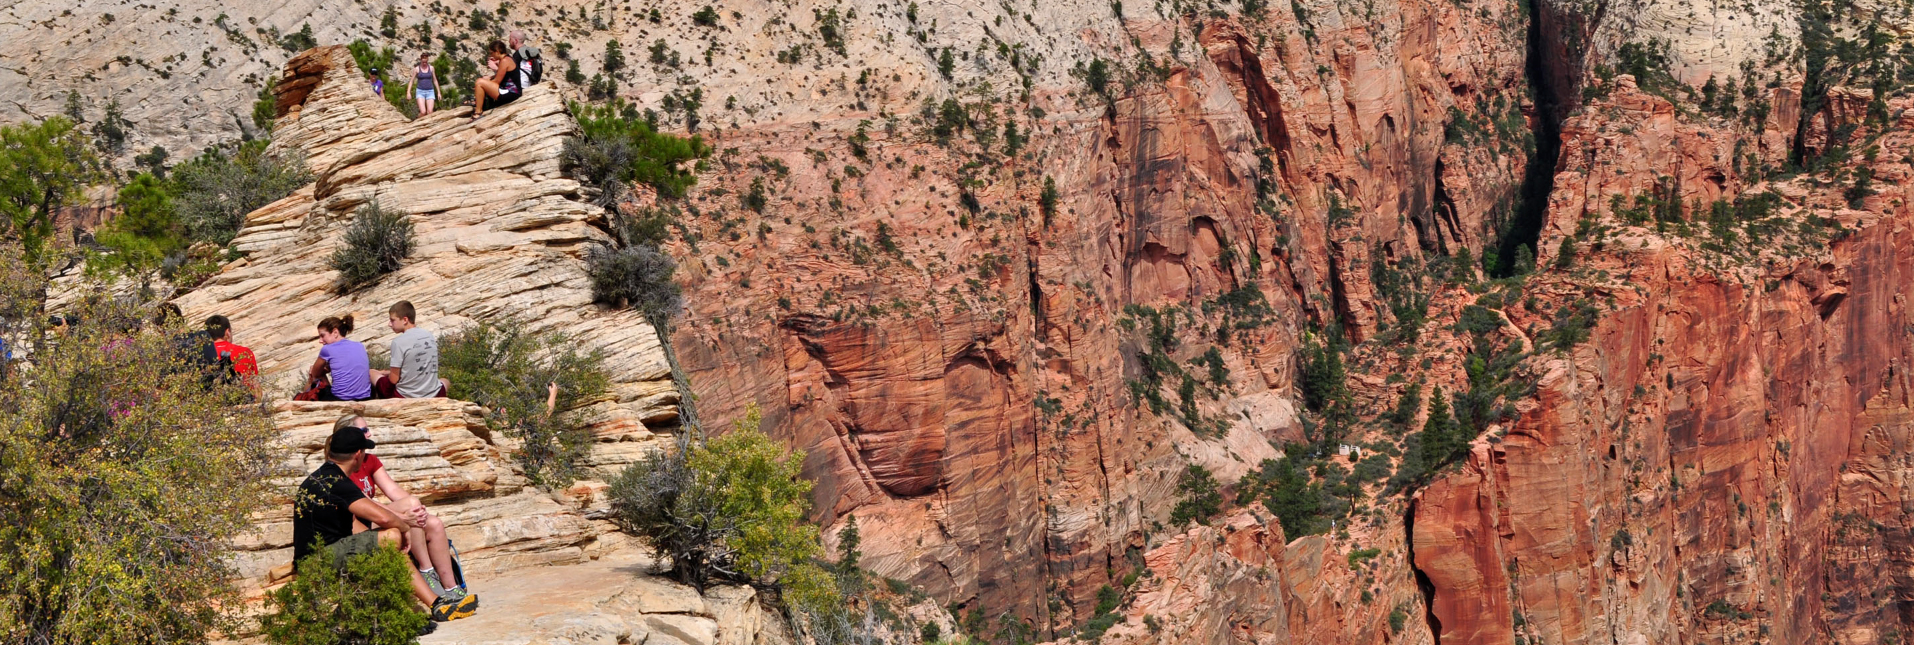
Utah’s national parks are more crowded than ever
Nowhere is the recreation boom on Utah’s public lands more apparent than at its national parks, especially Zion, one of the nation’s crown jewels. Over the past decade, visits to the 13 Utah destinations administered by the National Park Service jumped by nearly 73% to more than 15 million a year, according to park service data.
Some credit, or blame, depending on the perspective, goes to Utah’s famous “Mighty 5” tourism-promoting campaign, extolling the wonders of Zion, Arches, Capitol Reef, Canyonlands and Bryce Canyon, for the steep rise in visitors that is also swamping gateway towns, such as Springdale and Moab. Systemwide visitation peaked in 2016 with the park service’s centennial and dipped this year due in part to a prolonged government shutdown.
Utah national park visitors
No where is the recreation boom on Utah's public lands more apparent than at its national parks, especially Zion, one of the nation's crown jewels. Over the past decade, visits increased by nearly 73 percent to more than 15 million at the "Mighty 5" and eight others destinations administered by the National Park Service. This graph shows the total number of visitors at Utah national parks, 2010-2018.
Source: The National Park Service
Graphic by Christopher Cherrington | The Salt Lake Tribune
Utah is seeing a visitation spike triple the national average, and it extends to land administered by the U.S. Forest Service, Bureau of Land Management and Utah Division of State Parks, where hiking, camping, climbing and cycling are becoming more and more popular.
Zion’s Angels Landing and Emerald Pools trails are now so crowded that unbroken lines of hikers clog the pathways during the high season, and visitors can wait hours at the entrance to Arches before getting into the park.
The stratospheric growth has prompted the park service to develop visitor management plans at Zion and Arches. Both are exploring controversial reservation systems. Interestingly, visits declined at smaller destinations, such as Timpanogos Cave, Rainbow Bridge and Natural Bridges national monuments.
Utahns love their state parks, too
Tourism was also robust at Utah’s 43 state parks, which saw 7.4 million visits this year, a 54% leap over 2009. With nearly 1 million visits last year, Dead Horse Point is the busiest state park.
After a scathing financial audit in 2011, the Division of State Parks and Recreation, under the leadership of the late Fred Hayes, invested heavily in amenities to make state parks more fun to visit, offering more things to do and more ways to enjoy the parks.
Utah state park visitors
Visitation growth was no less impressive at Utah's 43 state parks, which saw 7.4 million visitors this year, a 63% increase over 2009. With nearly 1 million visits last year, Dead Horse Point is the busiest. This graph shows the total number of visitors at Utah state parks, 2009-2019.
Source: The National Park Service
Graphic by Christopher Cherrington | The Salt Lake Tribune
To that end, yurts, bike trails, boat rentals and even zip lines were added to many parks, and the public responded, according to state data. Visitation increased fivefold over the past decade to Dead Horse Point, located near Canyonlands’ Island in the Sky, sixfold at Goblin Valley, and tripled at Antelope Island and Kodachrome Basin.
The Division of State Parks is now looking at expanding the lands under its care by adding a “state monument” category to its list of destinations, starting with Danger Cave and Old Iron Town.
While state parks’ visits have climbed, the division’s registrations for off-road vehicles remained flat and sharply declined for snowmobiles over the decade.
The Greatest Snow on Earth is becoming the world’s most crowded
Bolstered by an epic winter in 2018-19, skier visits to Utah ballooned. For better or worse, visits grew by 35% at Utah’s five ski areas operating on national forest over the past decade, flooding Little and Big Cottonwood canyons with hordes of skiers on powder weekend days.
Last winter, a record 2.3 million people skied Alta, Snowbird, Brighton, Solitude and Snowbasin, according to the Uinta-Wasatch-Cache National Forest, thanks in part to the advent of multiresort passes that are bringing more destination skiers to Utah resorts.
Utah skier visits
Skier visits grew by 35% at Utah's five ski areas operating on national forest. Last winter 2.3 million skied Alta, Snowbird, Brighton, Solitude and Snowbasin, thanks in part to the advent of multi-resort passes that are bringing more destination skiers to Utah resorts. Snowbasin accounted for much of the past decade's growth.This graph shows the total number of visitors at Alta, Brighton, Snowbasin, Snowbird, and Solitude resorts, 2010-2019.
Source: Utah ski resorts
Graphic by Christopher Cherrington | The Salt Lake Tribune
Statewide, skier visits surpassed a record 5 million last year, bringing an economic impact of $1.6 billion, according to Ski Utah, the industry’s marketing arm.
Snowbasin accounted for much of the past decade's growth on national forest resorts, with more than 431,000 visits last year.
Overall recreational use on the Uinta-Wasatch-Cache, located outside Utah’s major metro area, climbed by 31% to 11.4 million visits, nearly equivalent to Utah’s “Mighty 5” national parks combined. Yet the national forest’s funding has not kept pace and currently amounts to about 30 cents per visit, according to Forest Supervisor Dave Whittekiend.
Coal production cratered this decade as industry hangs its future on exports
Old king coal is being dethroned. Utah coal production dropped precipitously since its peak in 2008 in response to disappearing demand, costing central Utah hundreds of coveted mining jobs. While the rest of the state has enjoyed economic expansion, job growth went in the wrong direction for Emery County after the closures of Deer Creek, West Ridge, Centennial and other once-productive mines.
The reduction in demand stems from the rise of renewable sources of electrical generation from solar and wind and early retirement of dozens of coal-fired power plants. The lost generation capacity is being replaced largely with natural gas, which burns more cleanly with half the carbon dioxide output per unit of electricity produced.
Utah coal production
This graph shows Utah coal production in tons, 2009-2018.
Source: Utah Geological Survey
Graphic by Christopher Cherrington | The Salt Lake Tribune
Last year eight mines produced 13.8 million tons, worth $454 million, a 33-year low, according to the Utah Geological Survey. Utah mines employed 1,316 that year, down from 2,028 a decade earlier. The survey expected production to increase to 15.7 million tons this year.
Utah’s coal country is seeking to revitalize the industry through exports to Japan, which is turning away from nuclear in the aftermath of the Fukushima meltdown and embracing coal for its power needs. Dropping coal production stabilized in 2015 when Utah’s largest producer Wolverine Fuels, formerly known as Bowie Resource Partners, began an aggressive export program through Bay Area ports.
Wolverine currently ships 3 million tons a year through Richmond and Stockton. The firm hope to dramatically increase exports, but transloading capacity for coal is lacking on the West Coast and political opposition to new facilities is fierce. Proposed terminals in Oakland, Calif., and Longview, Wash., are tied up in litigation and the Richmond, Calif., City Council is expected to vote Jan. 14 to ban coal handling.